Welcome back, everyone! This week's post is going to be a bit shorter than previous weeks. Primarily, I plan to explain the technology and instruments that we have used in the gathering, reduction, and analysis of the supernova data we have. Some of what I actually do in the process will be explained.
A logical place to start would be with the telescopes that gather most of our data. Because Dr. Milne lives here in Tucson, most of our data comes from telescopes in the area. Dr. Milne most often receives observing time on Mt. Bigelow and Kitt Peak. The supernova data obtained from Mt. Bigelow comes from the 61-inch Kuiper telescope. The Kuiper is quite old, and was originally used to scope out a proper spot for the '69 moon landing, among other lunar missions. It's currently owned and operated by Steward Observatory, and is generally used for observing by astronomers from the 3 Arizona State schools (U of A, NAU, ASU).
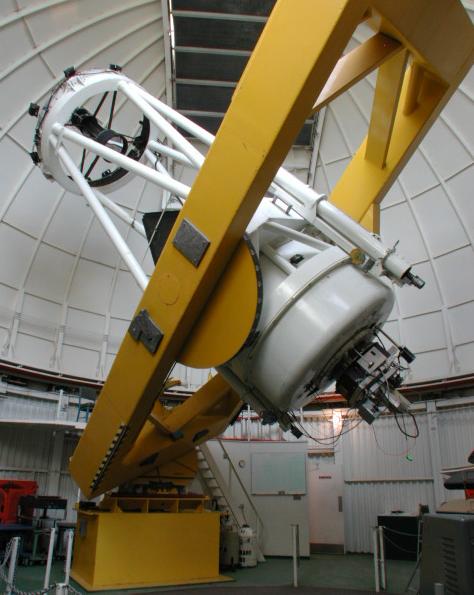 |
| The 61" Kuiper telescope. Courtesy Steward Observatory. |
Much of the rest of our data was gathered on Kitt Peak, at the 90" (2.3m) Bok telescope. The Bok is the largest telescope owned solely by Steward Observatory, and was dedicated in 1969. In 1996 it was named in honor of then Steward Observatory head Professor Bart Bok.
 |
| The Bok 90" telescope. Courtesy Wikimedia Commons. |
We have a small amount of data from the Large Binocular Telescope, or LBT, on Mt. Graham. The LBT is one of the world's most advanced optical telescopes, making use of two 27-foot mirrors which together give it the light gathering capability of a single 39-foot mirror and the optical clarity of a 75-foot mirror.
 |
| The Large Binocular Telescope. Courtesy Wikimedia Commons. |
The last of our data has come from the Holy Grail of telescopes, the Hubble. The data were not, in fact, taken by Dr. Milne but rather in a number of surveys conducted primarily by Nobel Laureate Dr. Adam Riess in searching for cepheids in other galaxies to get a better understanding of the expansion rate of the universe. A few data points are from the HST images, while the other images were primarily used in subtraction.
I have been observing with Dr. Milne at both the Kuiper and Bok telescopes, though our observing targets were not the supernovae that my research focuses on.
In addition to giving an overview of these telescopes, I would also like to briefly introduce the software that Dr. Milne and I have been using for image analysis. It's called IRAF (image reduction and analysis facility), and is a collection of many software components written by the National Optical Astronomy Observatory (NOAO). There are many packages and tasks that IRAF can perform. My roles primarily include fixing bad pixel strips, combining raw data images into stacked, usable data, performing subtraction on images to remove the background field from the supernovae, obtaining useful information about how bright objects are, and plotting the results. Each step involves quite a bit of code and user input, so this analysis is very time consuming. The results, however, tell us all of the information about the light echo I've mentioned previously; brightness, angular size, distance, color, and all the rest. In the past week, I have primarily been focused on stacking the raw images of our 2009 supernova, with some effort being put into subtraction on these same images.
That's all I have for you this week. I hope it wasn't too boring! Thanks for reading, everyone, and tune in next week for another post.
I'm so glad you're getting to spend some time observing. Observing trips were, in some ways, one of my favorite parts of the research process. I'm also impressed that you're using IRAF already. My memories of IRAF are that it's a monster of a program - powerful, but difficult to wrangle at times. Keep up the hard work!
ReplyDelete